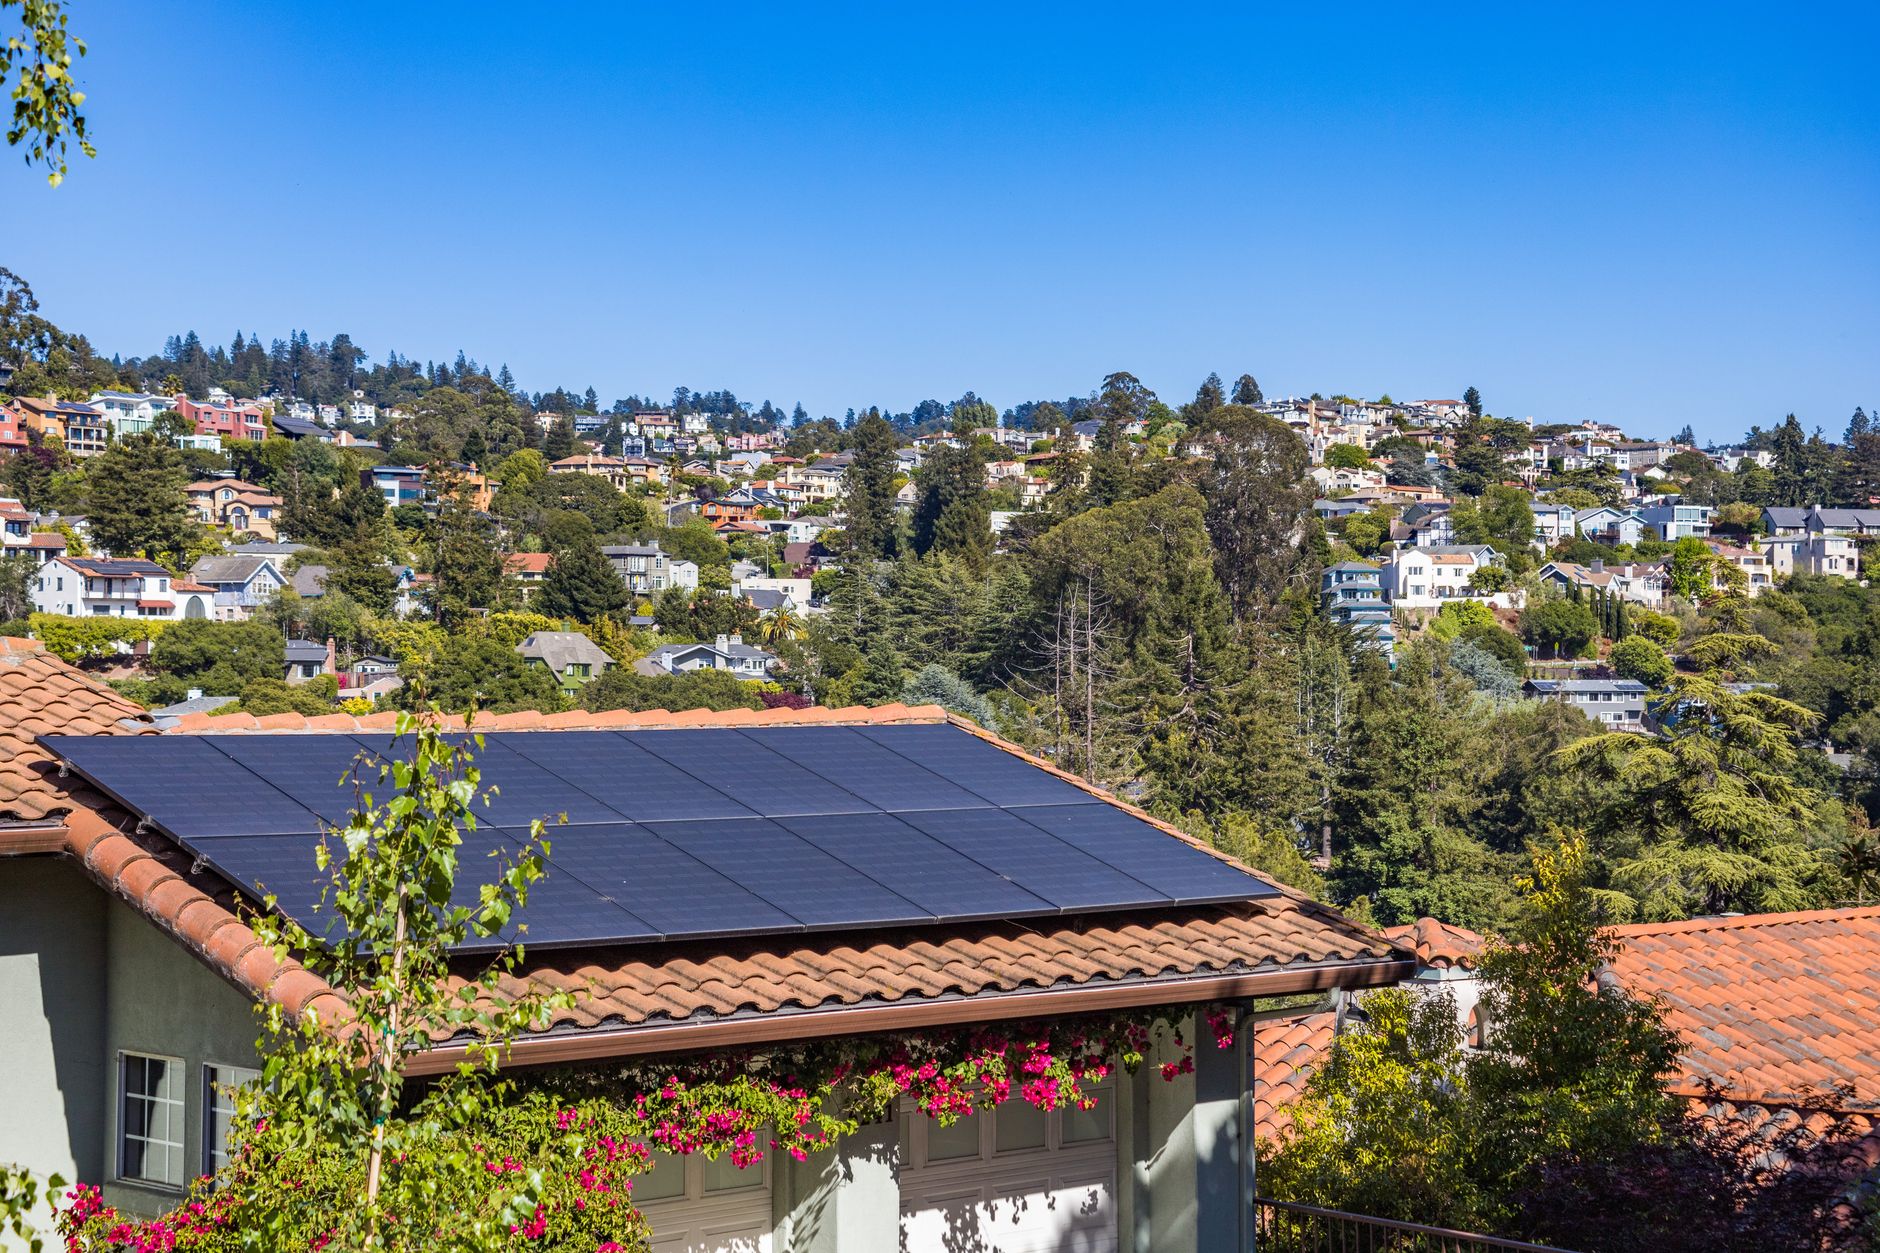
U.S. residential solar has moved from a niche purchase to a mainstream home energy upgrade. By the end of 2024, roughly 5.3 million homes had panels. By 2026, that total should climb to about 6.8 million, based on EIA small-scale generation data and current installation trends. That is not just a California story. Texas, Florida, and other high-outage states are adding solar faster than many older markets.
The shift matters for home energy independence. More homeowners pair panels with storage batteries to run lights, refrigerators, and HVAC during blackouts. The federal solar tax credit remains a key driver, while local net metering rules shape payback. This page breaks down the adoption numbers for 2026, including table data, state gaps, and what it means for whole-home backup.
| Adoption Metric | 2020 | 2022 | 2024 | 2026 Projection | Primary Source |
|---|---|---|---|---|---|
| U.S. homes with residential solar systems | 2.7 million | 3.9 million | 5.3 million | 6.8 million | EIA |
| Share of U.S. homes with solar | 2.6% | 4.3% | 6.1% | 8.0% | EIA |
| Cumulative residential PV capacity | 22 GW | 32 GW | 44 GW | 57 GW | EIA |
| Average residential system size | 7.0 kW | 7.6 kW | 8.2 kW | 8.9 kW | EnergySage |
| Average cost per watt before incentives | $2.81 | $2.86 | $2.91 | $2.78 | EnergySage |
| Residential solar share of U.S. electricity generation | 0.8% | 1.5% | 2.3% | 3.1% | EIA |
Projections for 2026 are OwnYourElectricity estimates based on EIA small-scale solar data, NREL capacity factor assumptions, and EnergySage quote trends. Figures are cumulative unless otherwise noted.
Why Is 2026 a Breakout Year for Home Solar?
The installation math changed because the federal Investment Tax Credit is locked at 30% for systems placed in service through 2032. That removes the year-end cliff that previously pushed buyers into short buying windows. Our solar tax credit 2026 guide explains eligible costs.
Cost per watt is no longer the only factor. 2026 solar pricing shows average costs around $2.78 per watt before incentives in projected quotes. At that price, a typical 8.9 kW system lands near $24,700 before the tax credit. Ten-year payback periods are common in high-rate utility territories, but states with low net metering export rates can stretch payback. The U.S. Energy Information Administration short-term outlook projects solar to add more U.S. capacity than any other source in 2026.
Grid reliability is another multiplier. Homeowners in areas with repeated outages now size solar and battery systems as backup, not just bill reduction. That pattern shows up in battery attachment rates. In 2020, only about 8.5% of new residential solar systems included storage. By 2026, that share should exceed 25%. The next section covers that shift.
How Battery Storage Changes the Adoption Curve
Solar adoption is no longer just about panels. The share of residential arrays with batteries has climbed from roughly 8.5% in 2020 to a projected 28% in 2026. Our home energy storage statistics detail the trend. The jump follows three forces: falling battery prices, longer utility outage durations, and time-of-use rate exposure.
Whole-home backup is the sharp edge of demand. A solar-only system stops producing when the grid goes down unless it has islanding hardware. Homeowners who want power during an outage are increasingly pairing panels with systems such as the options in our best whole-home batteries 2026 comparison. A residential battery sizing guide helps match capacity to furnace, refrigerator, and well pump loads.
National renewable energy lab modeling shows that a solar plus storage system can meet 70 to 90 percent of a home’s annual load in many U.S. climate zones, depending on roof orientation and weather. NREL data reinforces why states with high air conditioning demand, like Texas and Arizona, are pushing storage attachment higher. That changes the adoption math from simple payback to resilience value.
Which States Are Pulling the Market Forward?
California still has the largest cumulative residential solar base. But its growth rate slowed after net metering export rates changed. The state’s 2024 residential additions dropped from the 2022 peak, yet California likely remains above 1.7 million solar homes. New rooftop rules and battery incentives now push buyers toward storage instead of export-only systems. Our net metering guide explains what changed.
Texas is the fastest large market by residential megawatts added. Texas homes face long grid failure tails after storms and heat waves. Many buyers treat solar and storage as outage insurance. Florida ranks third, driven by high air conditioning loads and strong utility-scale solar buildout but weaker residential net metering. Arizona and Nevada also add large volumes relative to population. EnergySage quote data shows the median system size rising in Texas and Florida while panel efficiency improves. EnergySage tracks that shift.
State-level policy still creates two markets. Some states with low retail electricity rates or no solar access rights lag behind. Others with community solar or strong interconnection standards grow faster. That gap is not just sunny versus cloudy. New York and Illinois, for example, have residential solar growth despite less sun, because policy supports it. The result is a more spread out 2026 adoption map than five years ago.
What the 2026 Numbers Mean for Home Energy Independence
The projection of 6.8 million solar homes by the end of 2026 does not mean the grid will be irrelevant. Most solar homes stay connected to the utility. They use the grid at night or during cloudy stretches. But the size of the residential fleet now makes distributed solar a measurable reliability resource. In some regions, rooftop arrays reduce afternoon peak demand enough to ease capacity shortages.
For homeowners, the more important number may be battery attachment. A solar-only system has limited backup value. A solar plus storage system can keep critical circuits running during an outage. The 2026 solar adoption data signals that more buyers are thinking beyond net metering payback. They are buying a home energy asset that runs lights, medical devices, and freezers when the grid fails. Our home energy storage statistics show the capacity trends.
Buyers should still run the numbers. System cost, roof production, local export rates, and battery prices all move the payback. The federal tax credit helps, but local utility rules matter just as much. Start with our solar cost guide and then compare battery options before adding capacity. A licensed electrician should handle any transfer switch or panel upgrade.
Frequently Asked Questions
How many homes have solar panels in the U.S. in 2026?
About 6.8 million homes are projected to have residential solar by the end of 2026. That compares to roughly 5.3 million homes at the end of 2024.
What percentage of U.S. homes have solar?
The 2026 estimate is around 8.0 percent of U.S. households. The share was about 6.1 percent in 2024 and 2.6 percent in 2020.
Which state has the most residential solar systems?
California has the largest cumulative residential solar base, with more than 1.7 million solar homes. Texas and Florida add the most new residential capacity in many recent quarters.
How much does a typical home solar system cost in 2026?
The projected average cost is about $2.78 per watt before incentives. A typical 8.9 kW system would cost about $24,700 before the federal tax credit.
What share of new solar homes include battery storage in 2026?
The battery attachment rate is projected at about 28 percent in 2026. That is up from roughly 8.5 percent in 2020 and 18 percent in 2024.
Does solar power work during a grid outage?
Solar-only systems shut down during outages unless paired with a hybrid inverter and battery. Solar plus storage can run critical circuits, but a licensed electrician should install the backup equipment.
What Should You Remember?
- 6.8 million U.S. homes are projected to have solar by late 2026.
- Battery attachment rates have more than tripled since 2020, reaching about 28% in 2026.
- The federal solar tax credit remains 30% through 2032 for eligible systems.
- California, Texas, and Florida account for a large share of new residential solar capacity.
- Solar plus storage delivers real backup value, but solar-only systems cannot run during outages.